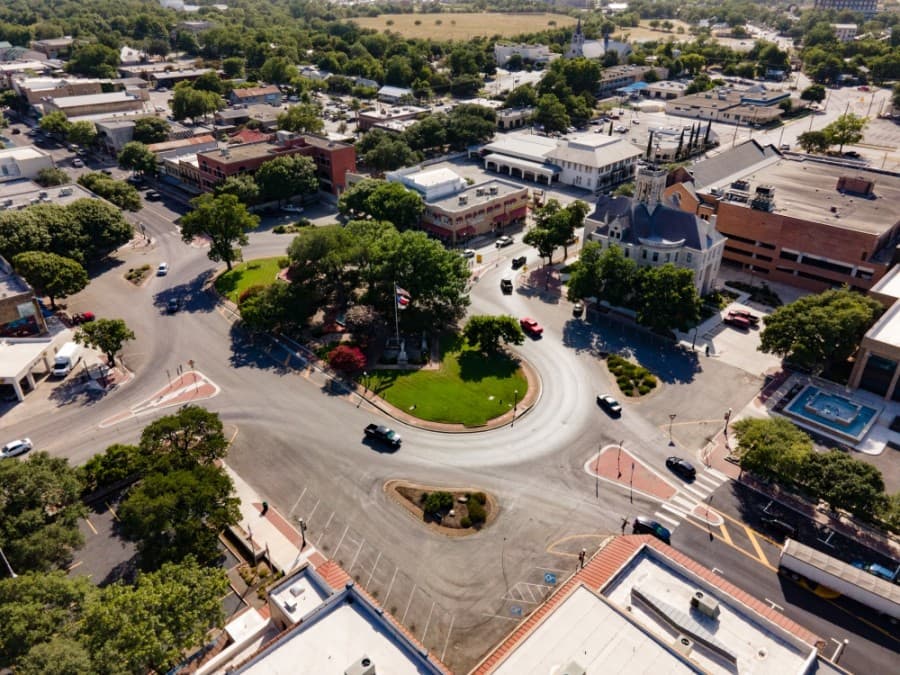
From 2014-2019, the city of New Braunfels has changed drastically in numerous ways.
When it comes to growth, New Braunfels proves why it is one of the fastest growing communities nationally through a near 50% jump over five years.
Compared against the state of Texas, which has only shown about a 7.5% increase over the same time period, the difference is significant.
New Braunfels has also gotten a little bit more diverse, and its median household income has increased dramatically.
SOURCES: U.S. CENSUS BUREAU AMERICAN COMMUNITY SURVEY 2019 5-YEAR ESTIMATES/COMMUNITY IMPACT NEWSPAPER
Population change
New Braunfels
2014: 61,712
5-year change New Braunfels: 46.99% increase
5-year change Texas: 7.53% increase
Median Household Income
New Braunfels
Median age: 35.1
Demographics*
New Braunfels
Hispanic or Latino: 37.7%
White: 57.3%
Black or African American: 3.1%
American Indian or Alaska Native: 0%
Asian: 1.4%
Native Hawaiian or other Pacific Islander: 0%
Some other race: 0%
Two or more races: 0.5%
Texas
Hispanic or Latino: 39.7%
White: 41.1%
Black or African American: 11.9%
American Indian or Alaska Native: 0.3%
Asian: 4.9%
Native Hawaiian or other Pacific Islander: 0.1%
Some other race: 0.2%
Two or more races: 1.8%
*Census data may not add up to 100% due to rounding
Education Level
New Braunfels
High School or higher achieved
2014: 87.2%
2019: 90.9%
Bachelor’s degree or higher achieved
2014: 26.7
2019: 34.7%
Texas
High School or higher achieved
2014: 81.6%
2019: 84.6%
Bachelor’s degree or higher achieved
2014: 27.1%
Largest employment sectors
New Braunfels
1: Management
2: Service
3: Sales and office
4: Construction and maintenance
5: Production, transportation and material moving
Texas
1. Management
2. Service
3. Sales and office
4. Construction and maintenance
5. Production, transportation and material moving