Posted 11:32 p.m.
Unofficial results show voters were in favor of a $845 million bond for the city of Fort Worth.
According to the unofficial totals released from the Tarrant, Denton, Parker and Wise counties elections office websites, all six propositions passed.
This was the largest bond program in the history of Fort Worth. In 2022, Fort Worth passed a $560 million bond.
What’s happening?
Unofficial final results show:
Proposition A: 13,749 yes, or 59.64%; 9,306 no, or 40.36%
Proposition B: 14,039 yes, or 60.91%; 9,010 no, or 39.09%
Proposition C: 14,451 yes, or 62.68%; 8,605 no, or 37.32%
Proposition D: 13,250 yes, or 57.52%; 9,786 no, or 42.48%
Proposition E: 14,844 yes, or 64.57%; 8,146 no, or 35.43%
Proposition F: 13,588 yes, or 59.07 %; 9,417 no, or 40.93%
Posted 9:30 p.m.
Unofficial results show voters are in favor of parts of the $845 million bond for the city of Fort Worth.
According to the unofficial totals released so far from the Tarrant, Denton, Parker and Wise counties elections office websites, all six propositions are showing as passing.
The details
Each bond proposition is individual, so if one does not pass, the city would not be able to issue money for the proposed projects within that proposition. Streets and mobility infrastructure is the largest portion at $511.5 million, or 60.5% of the overall bond, according to previous reporting.
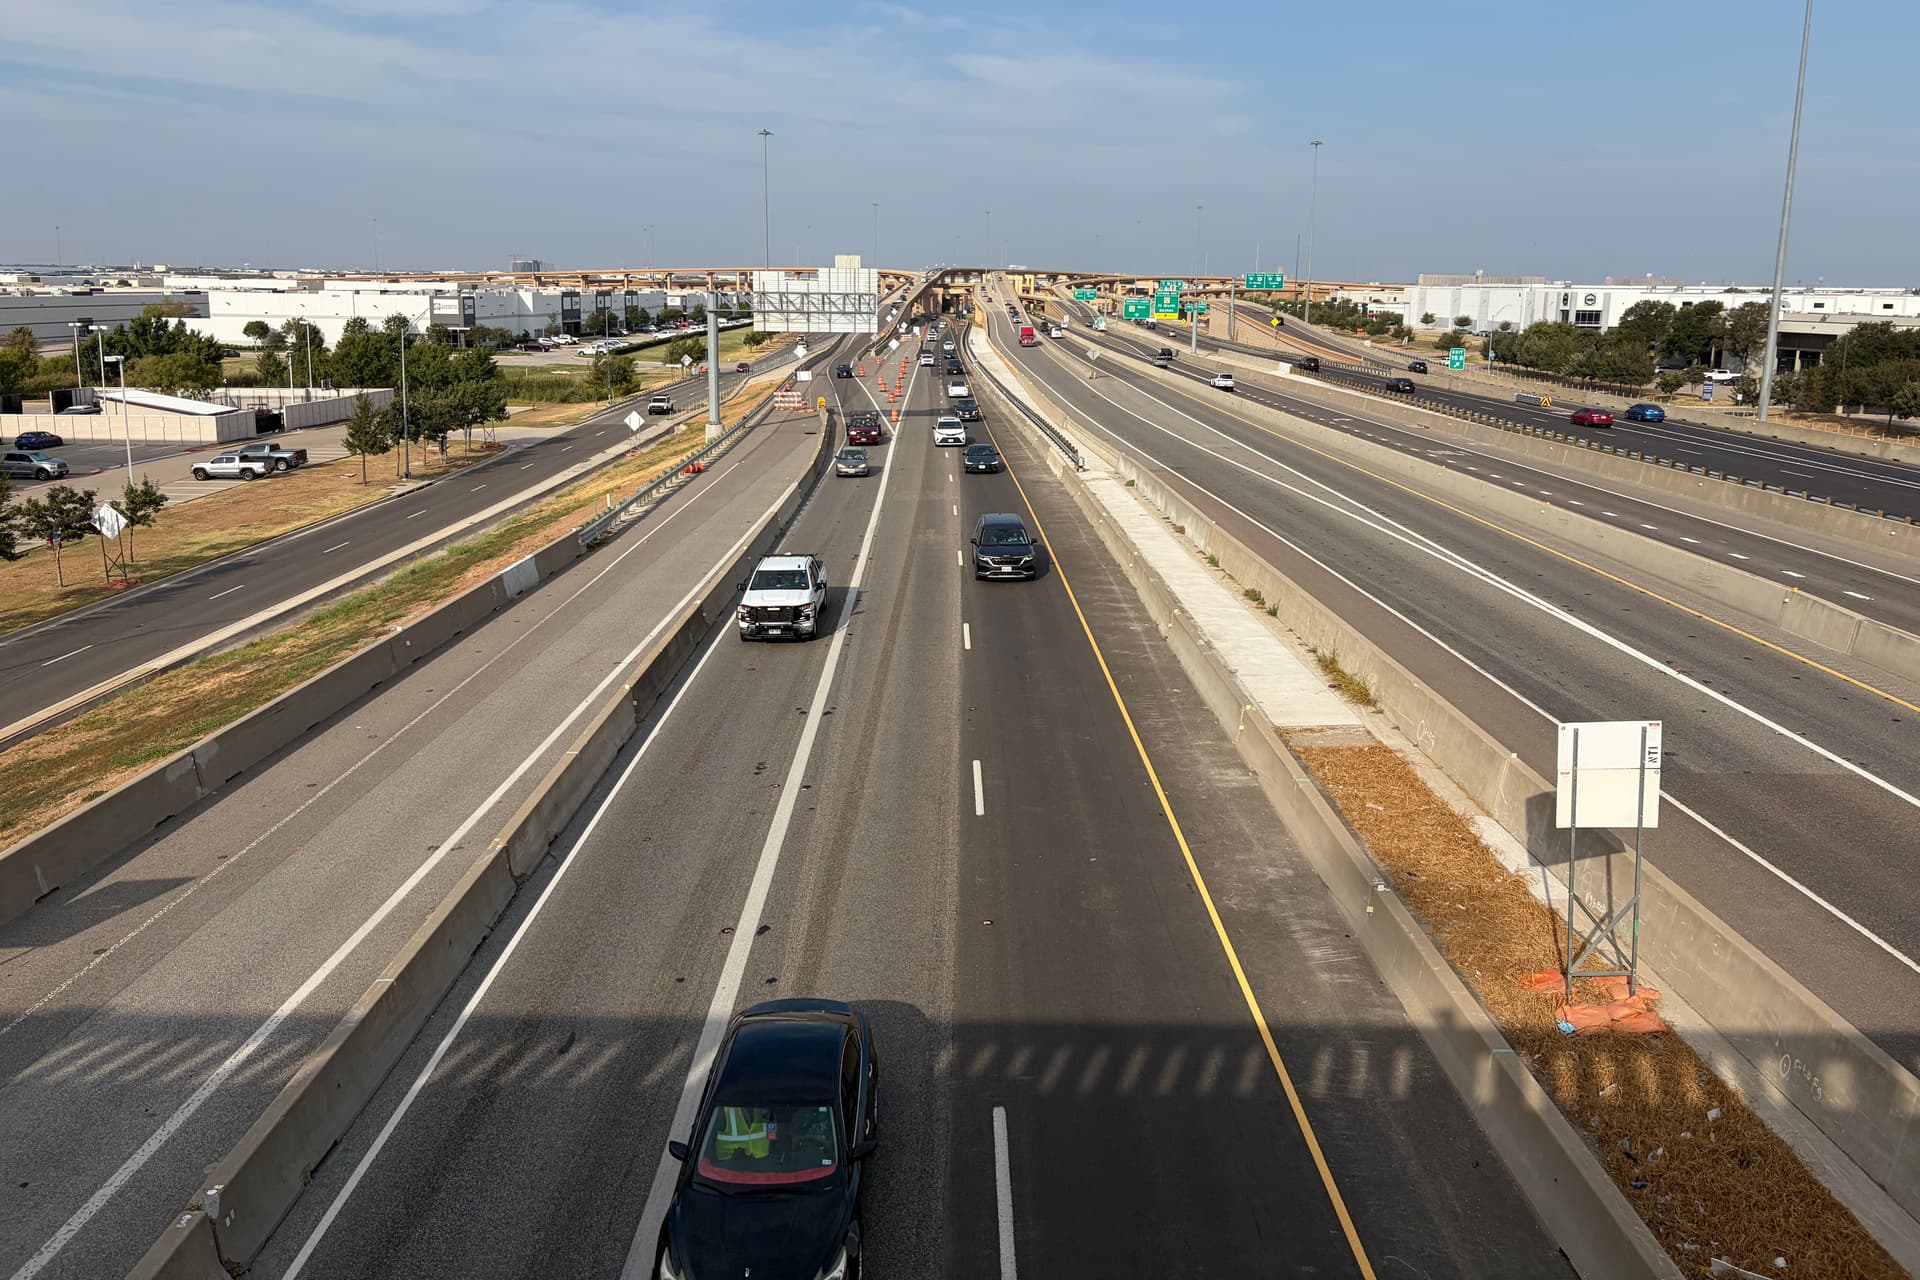
- Proposition A: streets and mobility infrastructure improvements, $511.48 million
- Proposition B: park, recreation, and open space acquisitions and improvements, $185.14 million
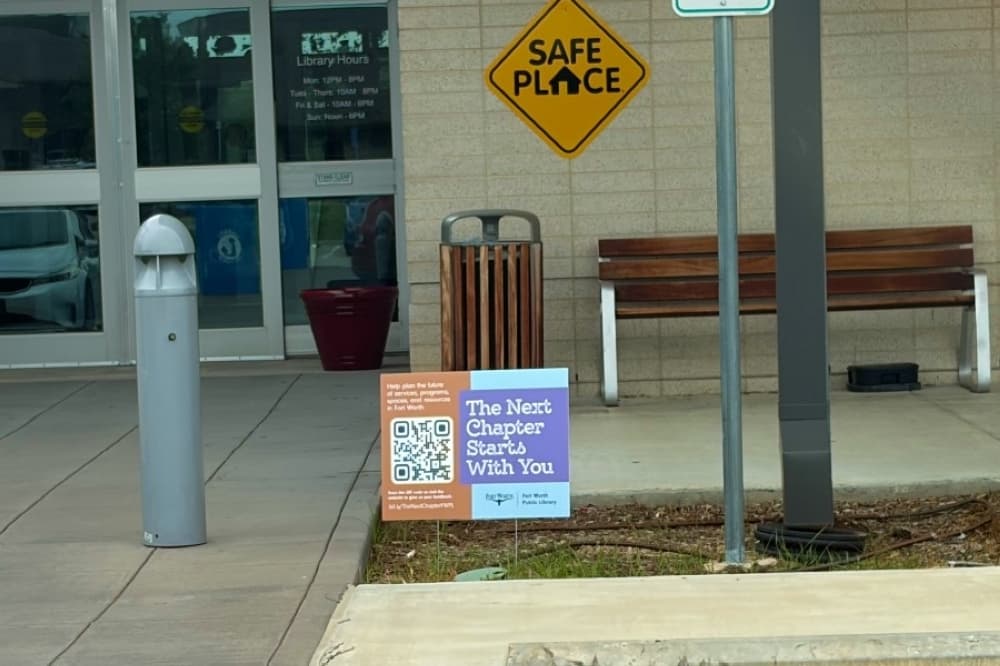
- Proposition C: public library improvements, $14.59 million
- Proposition D: affordable housing, $10 million
- Proposition E: police, fire, and emergency communications facilities, $63.92 million
- Proposition F: animal care and shelter improvements, $59.87 million
What’s happening?
Unofficial results show:
- Proposition A: 8,268 yes, or 59.63%; 5,597 no, or 40.37%
- Proposition B: 8,120 yes, or 58.94%; 5,657 no, or 41.06%
- Proposition C: 8,356 yes, or 60.64%; 5,424 no, or 39.36%
- Proposition D: 7,764 yes, or 56.34%; 6,017 no, or 43.66%
- Proposition E: 9,048 yes, or 65.72%; 4,720 no, or 34.28%
- Proposition F: 8,043 yes, or 58.48%; 5,710 no, or 41.52%
What’s next?
Community Impact will update this article as more election day vote totals are released. All results are unofficial until canvassed.