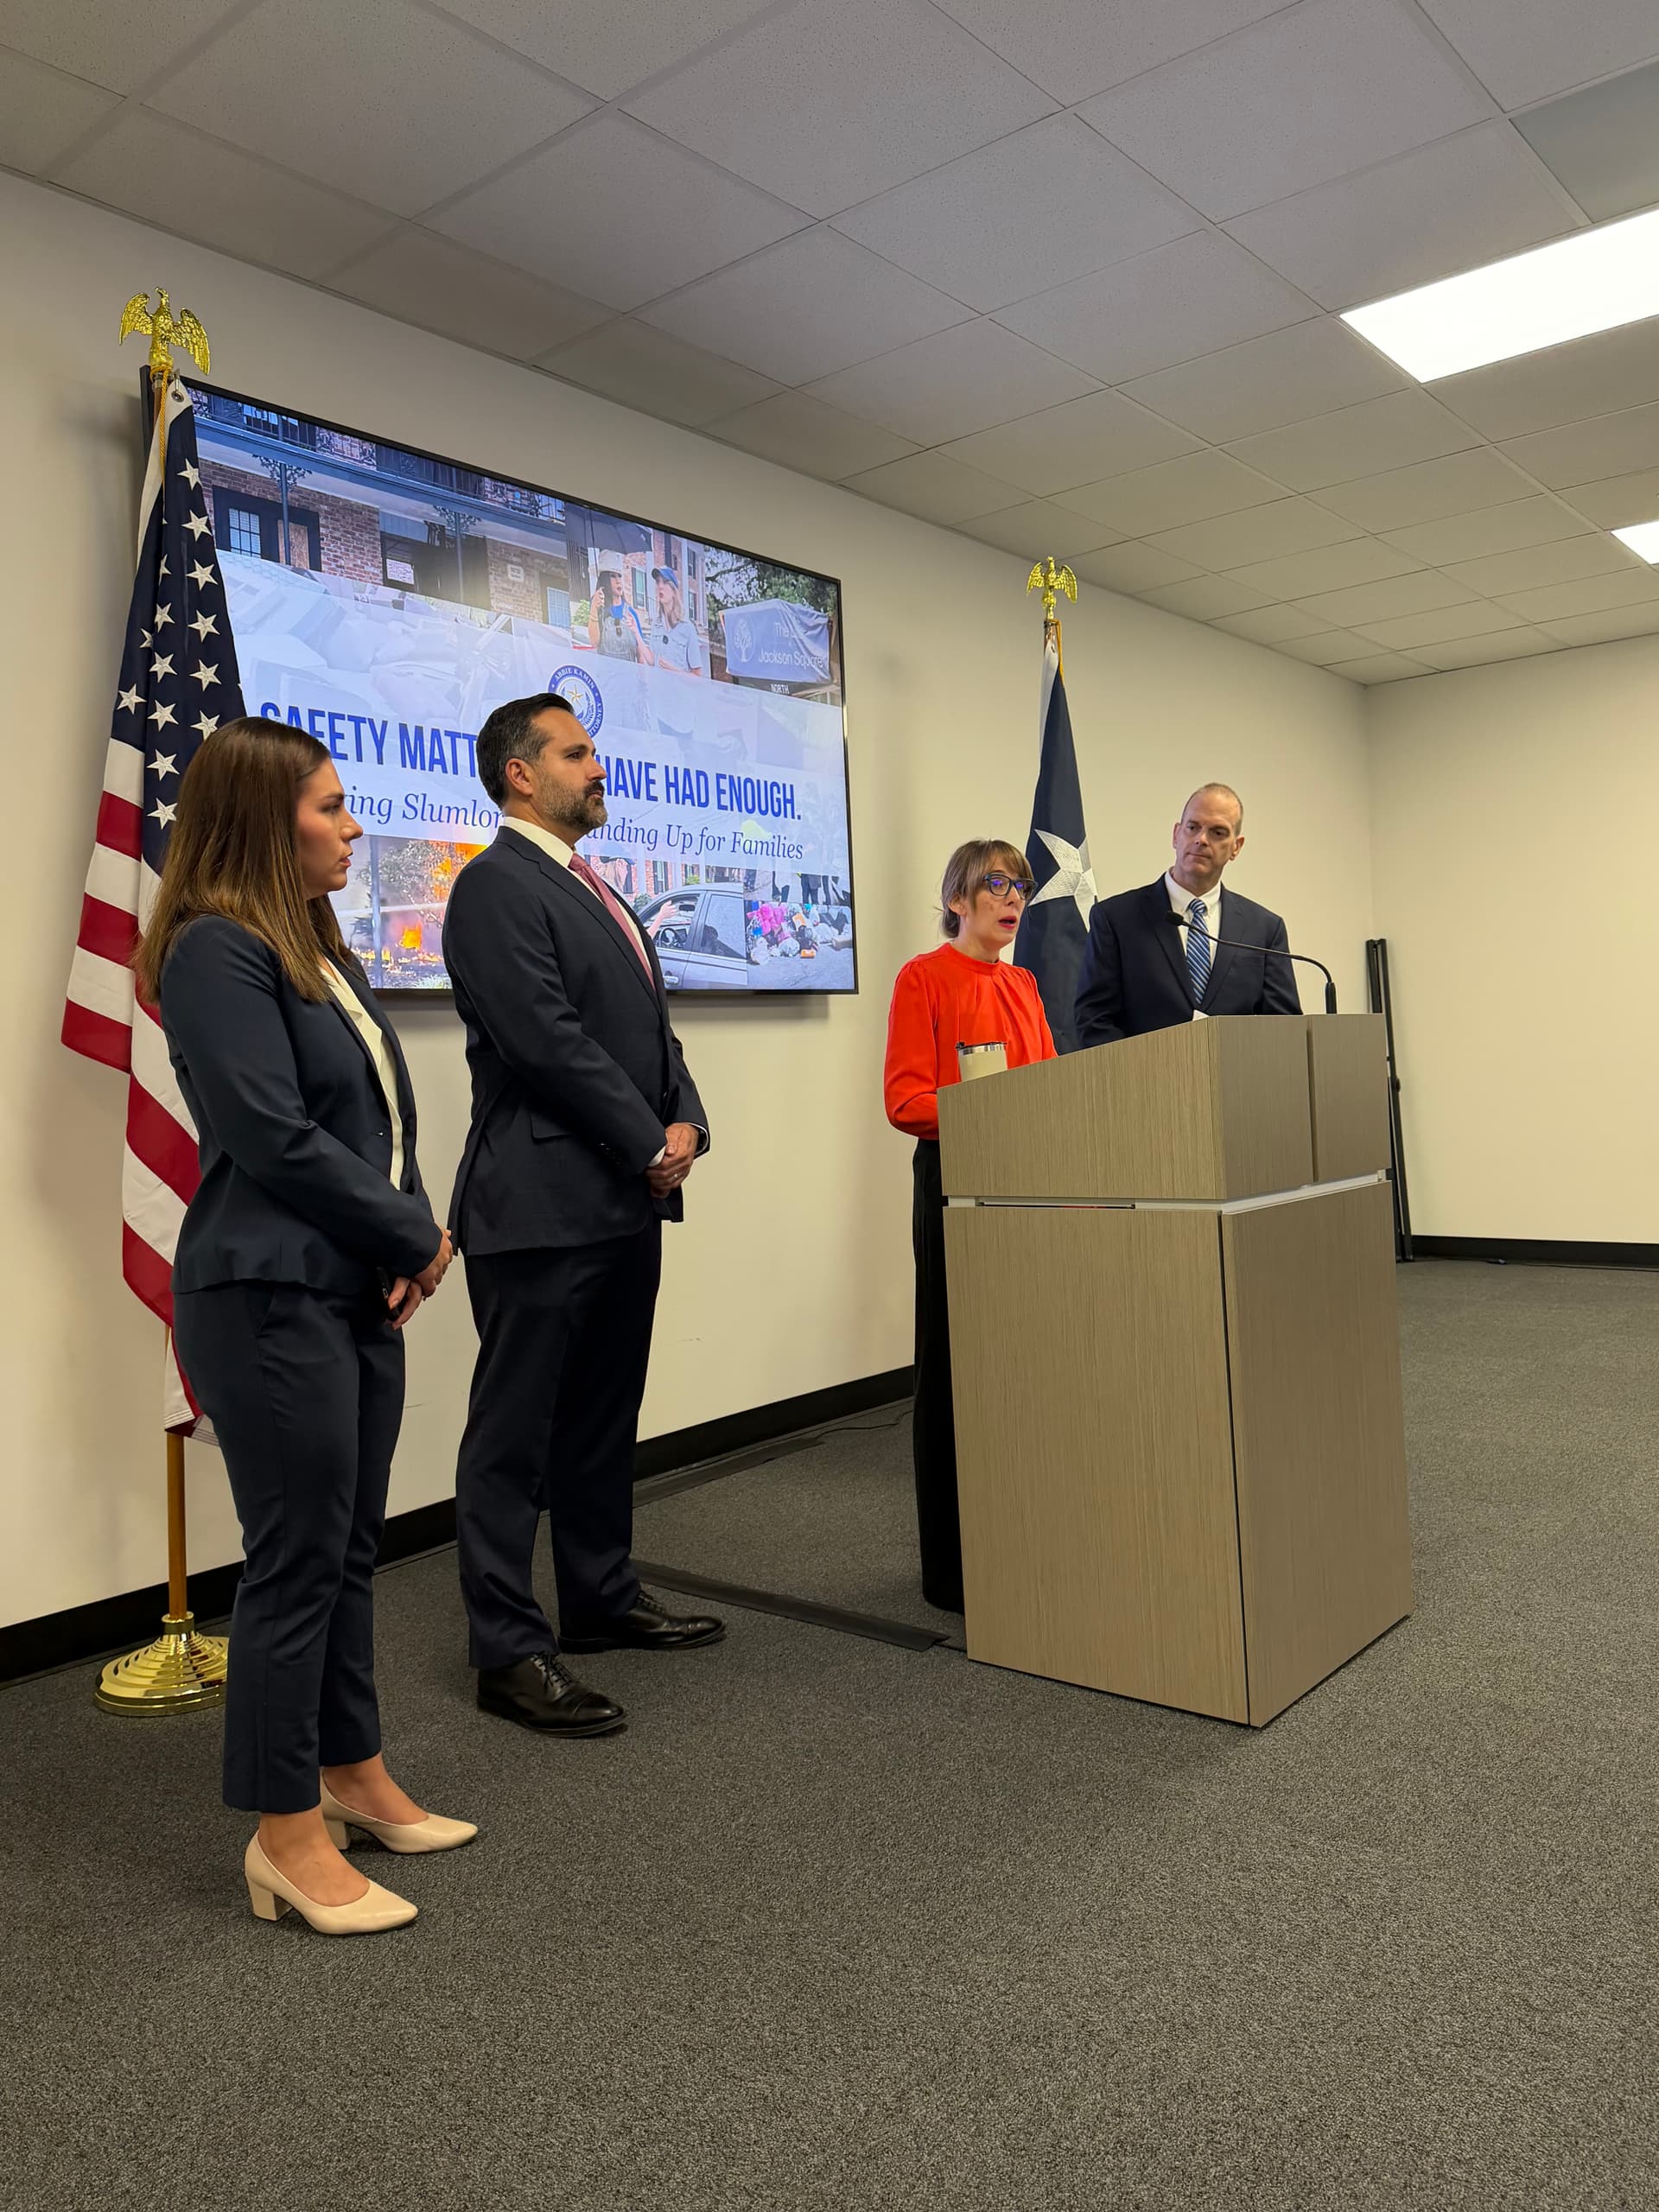
Leah Barton (center) was appointed Sept. 2, 2025, to lead the county’s public health department. (Courtesy Harris County Public Health)
Harris County Public Health rolled out a new localized dashboard that aims to identify health inequities Oct. 28, HCPH officials announced during a meeting open to the media but closed to the public.
How it works
The dashboard pulls together national, state and local data broken down into ZIP code-specific information in Harris County. The dashboard includes more than 60 health indicators across five domains:
Chronic and behavioral health
Housing and economic conditions
Neighborhood environment and conditions
Population health and prevention
Social and community conditions
HCPH Executive Director Leah Barton said the framework was developed with academic partners, healthcare partners and community organizations.
“What’s exciting to me about this effort is that this isn’t just another collection of a thousand indicators,” Barton said. “This is not just a collection of every metric that we could find. Folks really looked hard to say which indicators are the most representative of each of these domains and which give the most effective and most focused, most comprehensive picture of what we really need to be looking at as we’re thinking about what can improve the long-term health of our Harris County neighbors.”
The local impact
Barton said HCPH tested the tool with partners, employees and community members during mobile health events.
Jo Ann Monroy, HCPH senior data analytics and reporting manager, said the dashboard is designed to identify health inequity and disparities, so resources and information can be tailored to specific communities.
“We really wanted to empower community members to have data for the areas in which they live,” Monroy said. “We know it’s really important and can determine a lot of outcomes among various domains, health domains. So we wanted to make sure that people had access to look at the data where they live and how that might be affecting their daily lives.”
The takeaway
The dashboard maps a variety of data, from air pollution and walkability to life expectancy and colorectal cancer screenings.
Monroy said compiling the data reaffirmed a known pattern of less healthy neighborhoods, known as the Houston arrow. The arrow—a series of connected ZIP codes around downtown Houston that stretches into north and south Harris County—points to the right.
The Houston arrow, shown on this map through the percentage of diagnosed diabetes among adults, illustrates Houston-area neighborhoods that are typically less healthy than surrounding zip codes. (Courtesy Harris County Public Health)(Courtesy Harris County Public Health)
“I know with our HCPH leadership, we’re definitely going to incorporate those into future strategic plans and initiatives to make sure that we’re making as much of an impact as we can,” Monroy said.
With the new dashboard, Abha Adhikari, the health equity program manager, said HCPH is recruiting members to policy work groups to understand which policy recommendations will make “that data piece a little bit more actionable.”
The new accessible map will allow HCPH, alongside community groups and other organizations, to address unique community needs, Barton said.
“We also hope that our partners use this to help focus their resources and say, ‘Hey, which health intervention do I want to put into which neighborhood? What’s the right set of solutions for a given area?’” Barton said.