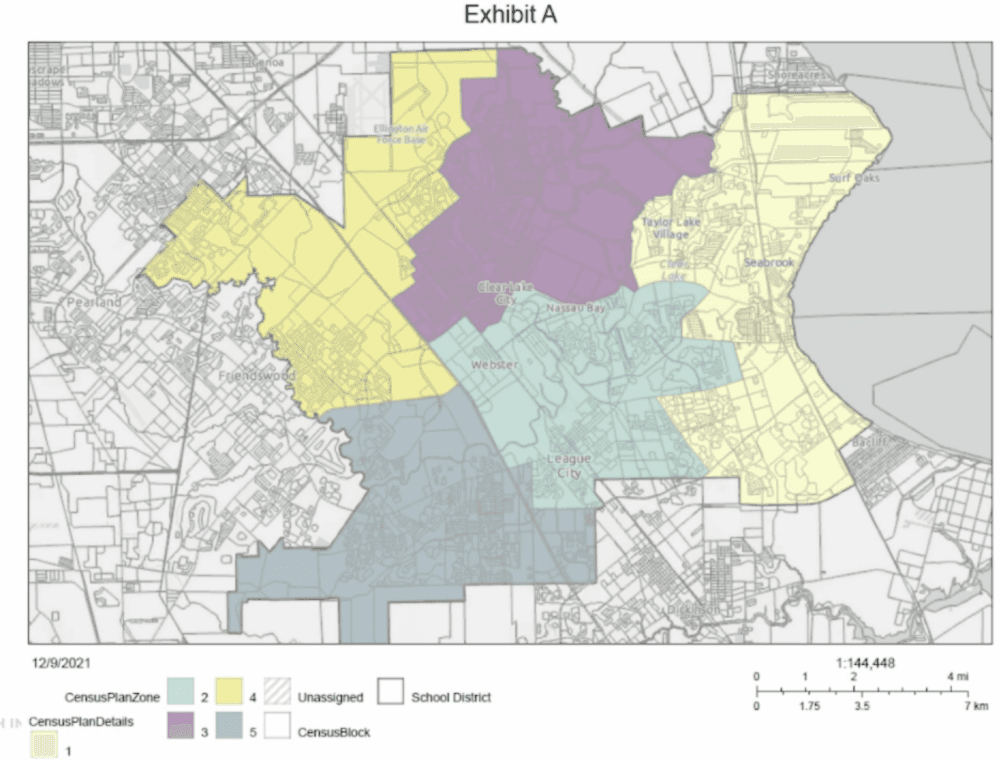
Clear Creek ISD trustees approved new single-member election boundaries Dec. 13 that closely follow the district’s boundaries for its five main high schools.
The board reviewed several plans prepared by Paul McLarty, deputy superintendent of business and support services, at a Dec. 6 workshop; the plan approved Dec. 13 is Plan E. At the workshop, McLarty used data from Templeton Demographics and census survey results to review how CCISD has grown in population over the last decade.
CCISD has five main high schools and comprises five single-member districts; the board therefore has two at-large trustees in addition to one representing each district. Laura DuPont and Scott Bowen in District 1 and At-Large Position B, respectively, are up for re-election in May.
Data shown at the Dec. 13 regular meeting indicates much of the district’s growth from 2010-20 was concentrated in districts 1 and 5. Overall, the district grew by about 37,000 people during that time.
Since population growth was unequal across the five districts, election boundaries needed to be redrawn to ensure continually equal representation, McLarty said. Districts 1 and 5 grew by nearly 30% in population, according to data presented Dec. 13. On the other hand, District 2 grew by about half that at 17%; District 4 grew by about 10% and District 3 grew about 3%.
Per Dec. 13 board presentations, the 14th and 15th amendments to the United States Constitution, as well as a section of the Texas Education Code, require CCISD to revise its boundaries if the total population of CCISD’s most populous district exceeds the total population in the least populous district by 10% or more.
“One of the goals was to try and make District 5 a little bit smaller in population so that over the next 10 years, it could grow as much as possible,” McLarty told trustees Dec. 6.
None of the five districts in the approved plan have 10% or more Black residents comprising their voting age populations, according to demographic breakdowns posted on the district’s website. The portion of Hispanic residents in the voting-age population ranges from 15%-25% depending on the district; three of the five districts have less than 10% of Asian residents comprising their voting age populations. The portion of white residents varies from 46% to more than 70%.